



What Is Group Delay?
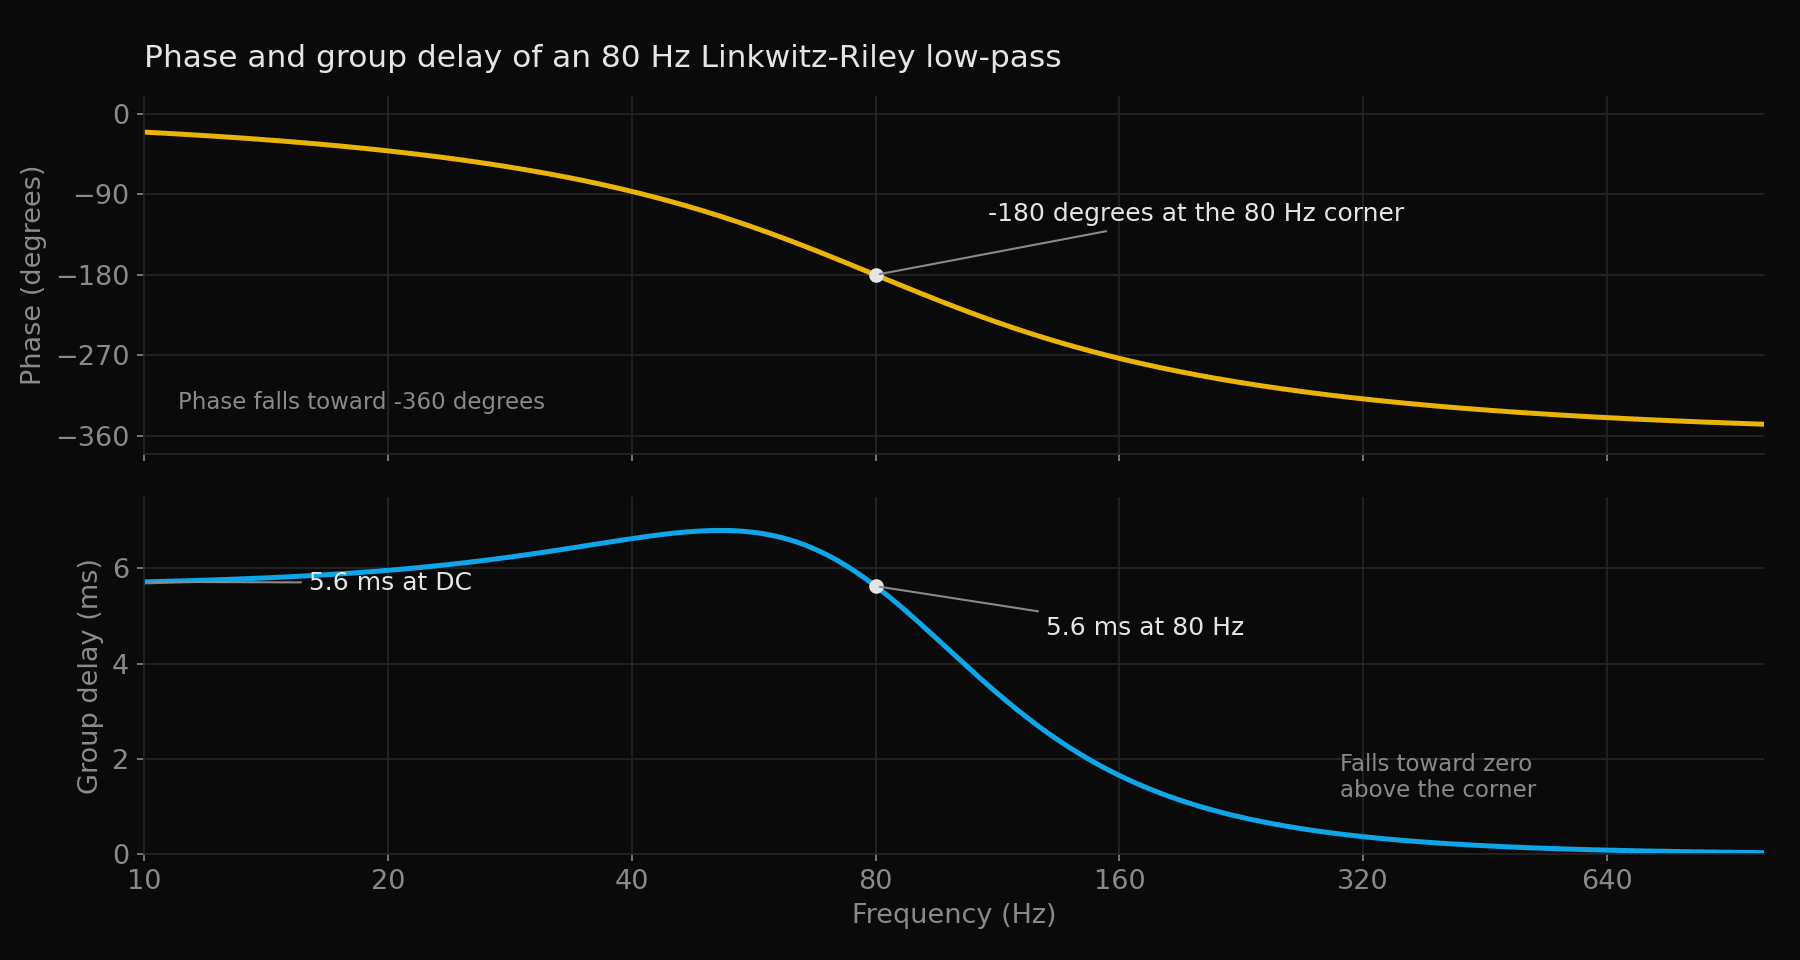
Group delay is how late each frequency arrives. It is the slope of the phase response against frequency, with the sign flipped, and it is measured in milliseconds. If every frequency is late by the same amount, the system is a pure delay and is inaudible on playback. If the delay changes with frequency, some parts of a sound trail others. An ideal 80 Hz subwoofer crossover has about 5.6 ms of group delay. A 2 kHz crossover has about 0.2 ms, against a threshold of about 1 ms.
Group Delay Is the Slope of Phase
A phase response gives how far each frequency has advanced through its cycle by the time it leaves the system. If the phase falls faster as frequency rises, the higher frequencies have been held back for longer. Group delay is that rate of fall expressed as a time. In words, it is minus the change in phase divided by the change in frequency, with phase in radians and frequency in radians per second, which gives seconds.
- Group delay
- Minus the slope of phase against angular frequency, in seconds. It gives how late a narrow band of frequencies around that point arrives.
A pure delay of 3 ms shifts phase by an amount that grows in a straight line with frequency. The slope of a straight line is constant, so the group delay is 3 ms at every frequency. That case is constant group delay, and it is the same thing as latency. A filter whose phase curves has a slope that changes, so its group delay changes with frequency. Varying group delay is the case with a measured threshold of audibility.
The ideal 4th-order Linkwitz-Riley crossover is a worked example. At the lowest frequencies its group delay is 2 times the square root of 2, divided by 2π times the crossover frequency. At 80 Hz that is 5.6 ms. At 300 Hz it is 1.5 ms, and at 2 kHz it is 0.23 ms. The delay is inversely proportional to the corner, so a crossover set ten times lower carries ten times the delay.
Excess Group Delay and Latency
Sound takes 2.9 ms to travel one metre, so a microphone 3 m from a speaker records a group delay near 8.7 ms before the speaker has done anything to the signal. That flat offset is arrival time. Measurement software estimates it and subtracts it. What remains is the excess group delay, the part that makes some frequencies late relative to others.
Latency is the delay of the whole signal through a device, the same at every frequency. It adds to the arrival time and nothing else. A converter with 1 ms of latency moves the entire group delay trace up by 1 ms and leaves its shape alone. Only the shape of the trace, the excess, changes how the timing between frequencies sounds.
Latency matters for other reasons. Anything you play or sing through the device arrives late by that amount. Between two speakers that share a band, a difference in latency is a difference in arrival time, which is covered in the article on polarity, delay and phase.
Where Group Delay Comes From in a Speaker
Every filter that changes level also changes phase, and so adds group delay near its corner. In a speaker there are two places this happens. The first is the crossover between drivers. The second is the low-frequency roll-off of the box, which is a high-pass filter whether or not anyone designed it as one.
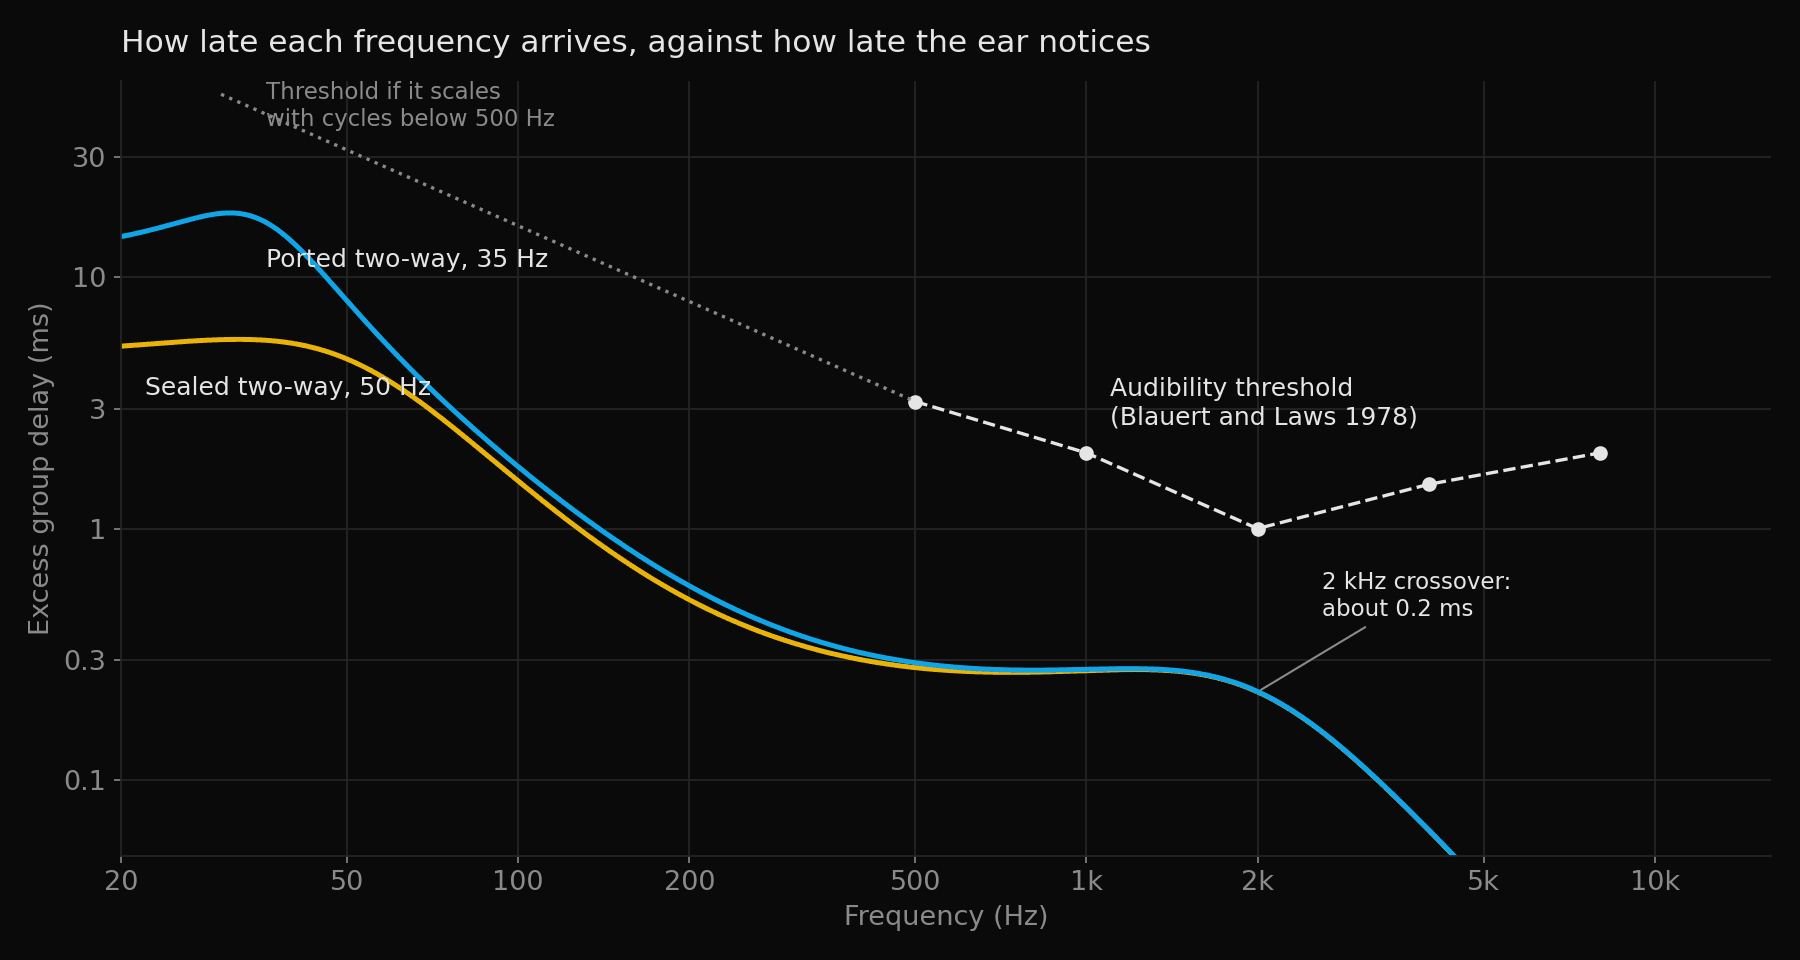
An ideal LR4 crossover adds 5.6 ms at 80 Hz, 1.5 ms at 300 Hz and about 0.2 ms at 2 kHz. A sealed box rolling off at 50 Hz adds about 5 ms, and a ported two-way at 35 Hz 15 to 20 ms. These are textbook models, not measurements, and the full source table is in the article linked below.
Group delay follows the corner frequency. A lower corner means a longer delay, so the large figures are all in the bass. The ported box is the largest case here because the model gives it a 4th-order high-pass at a low frequency. The study's models put every driver at the same depth. Real drivers sit at different depths, which the study estimates adds a few tenths of a millisecond of excess at high frequencies (about 0.1 ms for every 3.4 cm of offset), still under the 1 to 2 ms thresholds there.
How Much Can You Hear
Blauert and Laws measured in 1978 how much variation in group delay listeners could detect. The thresholds are 3.2 ms at 500 Hz, 2 ms at 1 kHz, 1 ms at 2 kHz, 1.5 ms at 4 kHz and 2 ms at 8 kHz. A 2 kHz crossover adds about 0.2 ms against a threshold of about 1 ms. Below 500 Hz the data stops, and later work, including Liski et al. (2018), finds larger thresholds there. Scaling the threshold with the period below 500 Hz is the study's modelling assumption, not a measured value.
Reading a Group Delay Plot
Read a group delay plot from the definition. It is a slope, so each point gives how fast phase is changing at that frequency. A flat line at any height means the phase is a straight line there, and a straight line is a pure delay. The height of that flat line is arrival time. Changes in height are the excess.
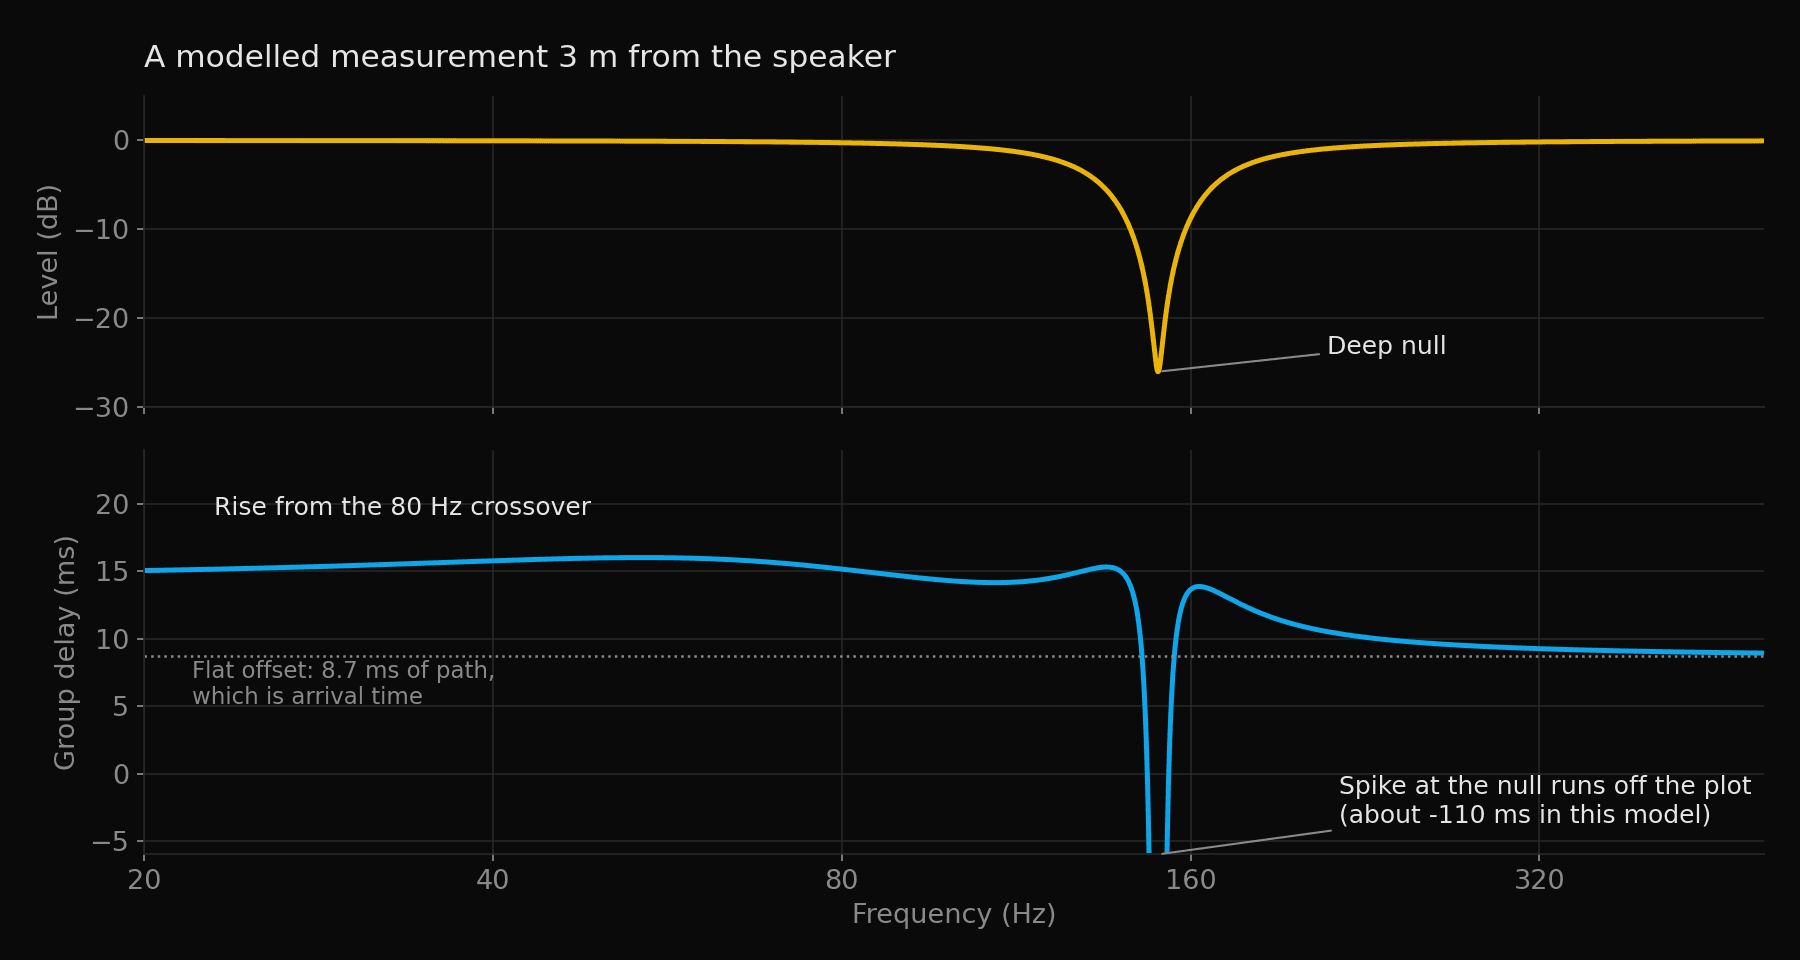
Spikes at deep nulls follow from the same definition. Near a null the level has dropped almost to nothing and the phase swings quickly across it, so its slope becomes very large. There is almost no sound at that frequency to be late. In the model above the spike points downward. In a real measurement it can point either way, and its height reflects the depth of the null, not timing.
A slope also magnifies small wiggles in the phase, so noise in a measurement shows up in the group delay trace as roughness. How much windowing or smoothing a given piece of software applies before drawing group delay changes how the trace looks, and the amount varies between products.
What to Do With the Number
Compare any group delay figure with the threshold at its own frequency before acting on it. A modelled two-way from 200 Hz up sits at 0.10 times the threshold before correction, and linearising its 2 kHz crossover costs 0.8 ms. The large figures are in the bass, where the box roll-off and the sub crossover sit, and where the threshold is disputed.
Removing group delay costs latency. A filter that flattens group delay has to delay everything to match the latest frequency, and in the bass that delay is 19 ms for an 80 Hz crossover and 82 ms for a ported box. That trade is the subject of Where the Latency in Linear-Phase Room Correction Comes From.
Rules of Thumb
Frequently Asked Questions
What is group delay?
It is how late a narrow band of frequencies arrives, taken as minus the slope of the phase response against frequency. If the phase is a straight line the group delay is constant and the system is a pure delay. If the phase curves, the group delay changes with frequency.
Is group delay the same as latency?
Latency is group delay that is the same at every frequency. It moves the whole trace up and does not change how the timing between frequencies sounds. Group delay that varies with frequency is a different thing, and it is the part with a threshold of audibility.
Why does my group delay plot sit at 8 ms?
Mostly distance. Sound covers a metre in 2.9 ms, so a microphone 2.75 m away adds about 8 ms before the speaker contributes anything. That flat offset is arrival time. Look at how the line changes with frequency, not at its height.
How much group delay can you hear?
Blauert and Laws (1978) found about 1 ms at 2 kHz, 2 ms at 1 kHz and 8 kHz, 1.5 ms at 4 kHz and 3.2 ms at 500 Hz. Below 500 Hz the research is disputed, and later work finds larger thresholds. Treat the bass figures as unsettled.
How much group delay does a crossover add?
For an ideal 4th-order Linkwitz-Riley crossover, about 5.6 ms at 80 Hz, 1.5 ms at 300 Hz and 0.23 ms at 2 kHz. Those are modelled figures for textbook filters. A real speaker with offset drivers adds about 0.1 ms for every 3.4 cm of offset at high frequencies.
Why does the plot spike at a null?
Because group delay is a slope, and phase changes quickly where the level collapses. The spike describes the shape of the null and has little to do with sound arriving late, since there is almost no sound there.
Can group delay be negative?
Locally, yes. Near a deep notch the phase can rise with frequency, and minus a rising slope is a negative group delay. It does not mean sound arrives before it was sent.
Conclusion
Read group delay as the slope of phase, and remove the flat offset first, because that offset is distance and latency. Judge what is left against the threshold at each frequency. In the midrange the figures are below the threshold, around 0.2 ms at a 2 kHz crossover against about 1 ms. In the bass they are larger, 5.6 ms at an 80 Hz crossover and 15 to 20 ms for a ported box, and the threshold there is not settled. Flattening that delay costs latency, so flatten it only where it sits above the threshold, and work out the latency first.
Glossary
- Group delay
- Minus the slope of phase against angular frequency, in seconds. How late a narrow band of frequencies arrives.
- Excess group delay
- Group delay once the arrival time is subtracted. The part that makes some frequencies late relative to others.
- Latency
- Delay that is the same at every frequency. It shifts the whole signal and leaves its shape alone.
- Arrival time
- The flat offset in a measured trace, mostly the distance from speaker to microphone at 2.9 ms per metre.
Sign up to hear more when we release something new


