


What a Phase Graph Is Measured Against
A phase graph never shows the phase of one thing on its own. Every trace is the difference between two signals, and the zero line is whatever the measurement compared against. Three references are common: the signal that was sent, an arrival time the software picked, and another speaker. Each one gives a different picture of the same speaker, and reading a graph against the wrong one can make a delay look like a fault in a speaker. The phase drawings on the NEXUS page plot the sub relative to the mains, so the mains sit flat on zero by definition. This article shows how to tell which reference any phase graph uses.
A Phase Graph Is a Difference Between Two Signals
A phase value gives how far one signal is ahead of or behind another, in degrees of one cycle at that frequency. A single signal has no phase until something else is chosen to compare it with. Every phase graph plots that difference frequency by frequency, and the zero line is whatever the measurement compared against.
- Reference
- The signal or time that a phase graph treats as zero. Every trace on the graph is drawn as the difference from the reference.
Three references cover most graphs you will meet: the signal that was sent to the speaker, an arrival time chosen by the measurement software, and another speaker. The same speaker measured in the same place looks different against each of the three. Reading a phase graph starts with finding out which reference it uses.
Why You Can't Hear Absolute Phase draws one sub against all three references in a single figure. The three pictures differ, and the sub, the room and the microphone position are the same in each.
Against the Source Signal
A dual-channel measurement plays a test signal, records the microphone, and compares the two. The software divides the microphone recording by the signal that was sent, so the phase graph covers everything between the two points: the converters, the interface buffers, the speaker and the air. The sent signal is the zero line.
Without a delay setting, all of that time shows up in the phase. Every millisecond of delay turns the phase by 360 degrees at 1 kHz, so interface latency and the flight time to the microphone tilt the trace and make it wrap round the chart. Those wraps describe the measurement chain and the distance, not the speaker.
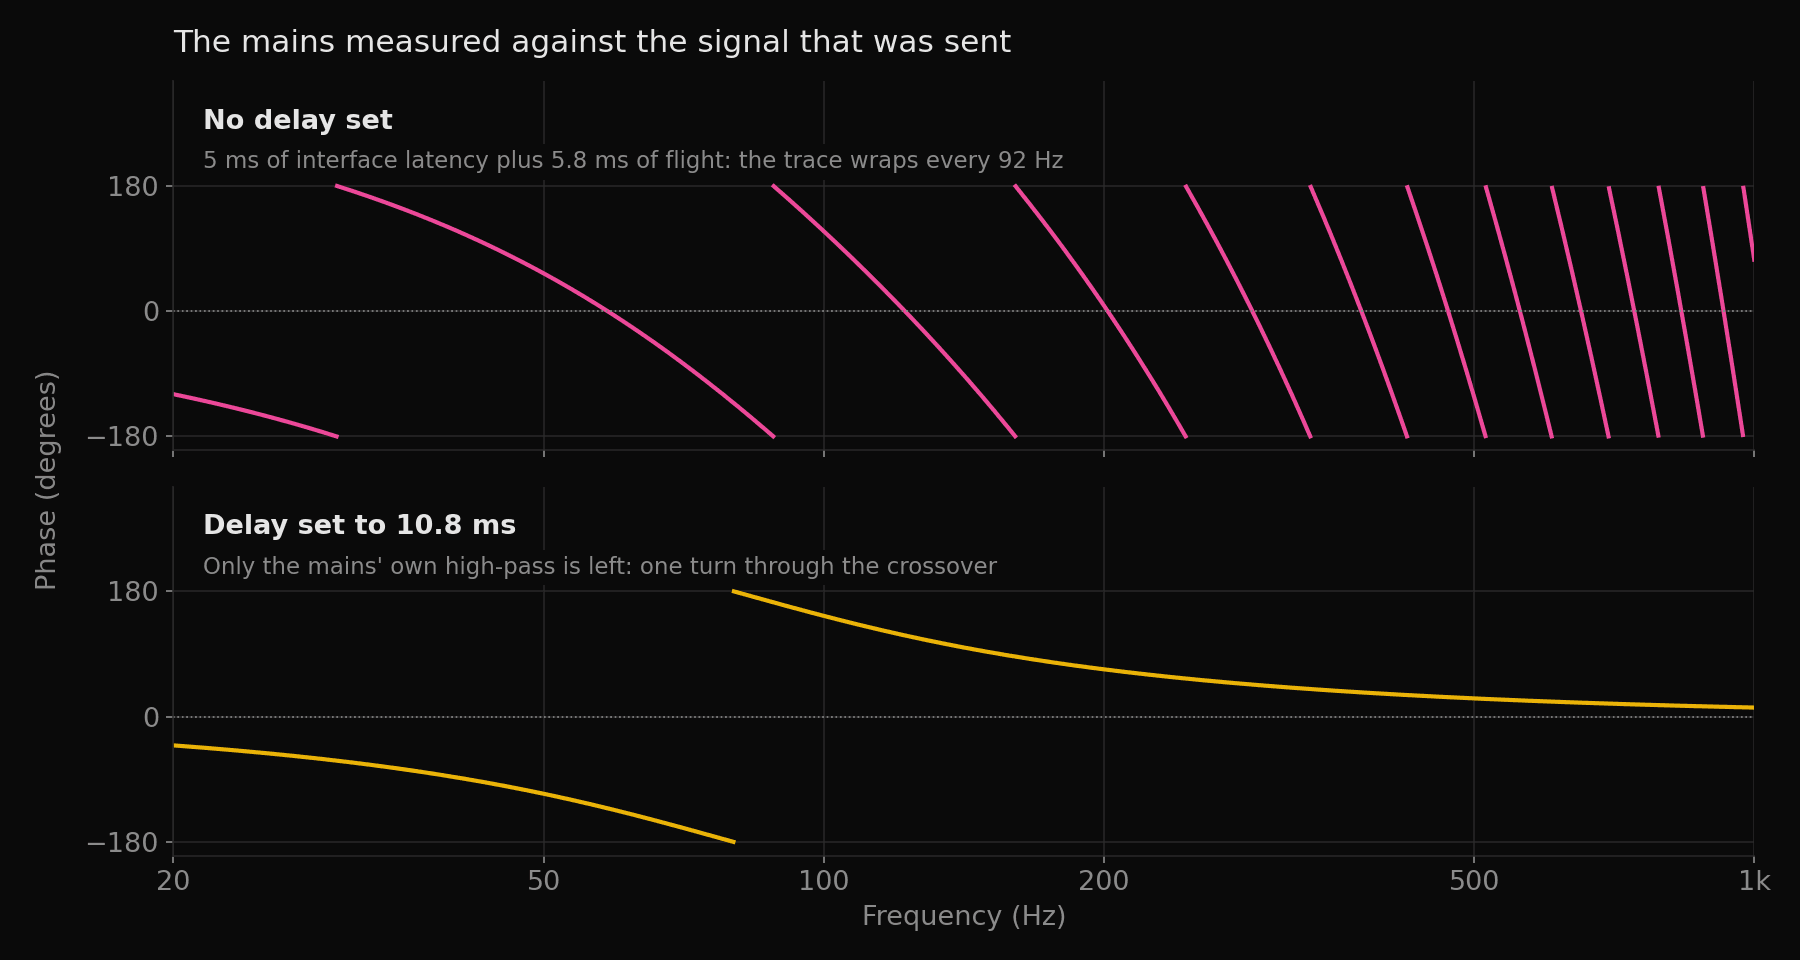
The usual remedy is a delay setting in the measurement software. Set to the total of latency and flight time, the delay shifts the sent signal so the two line up, and the graph then shows the speaker's own phase. The bottom panel above is that case.
Omnissiah plays pink noise through the selected output and measures the round-trip latency from output to microphone. Each snapshot stores that latency with the measurement. Keeping the latency stable is what lets two speakers measured one after the other line up to a common time reference, which is why the manual asks for one interface for mic and speakers, or Clock Drift Correction where they are separate.
Against an Arrival Time
Most measurement software finds the arrival time for you. The software estimates when the sound reached the microphone, takes that delay off, and plots what is left. What is left is the excess phase: the part that changes the timing between frequencies rather than delaying all of them together.
The software has to pick one delay, and the choice moves the whole trace. Take off too little and the trace tilts down with frequency. Take off too much and it tilts up. A 0.5 ms error is 180 degrees at 1 kHz and 360 degrees at 2 kHz, which can look like a fault in the speaker.
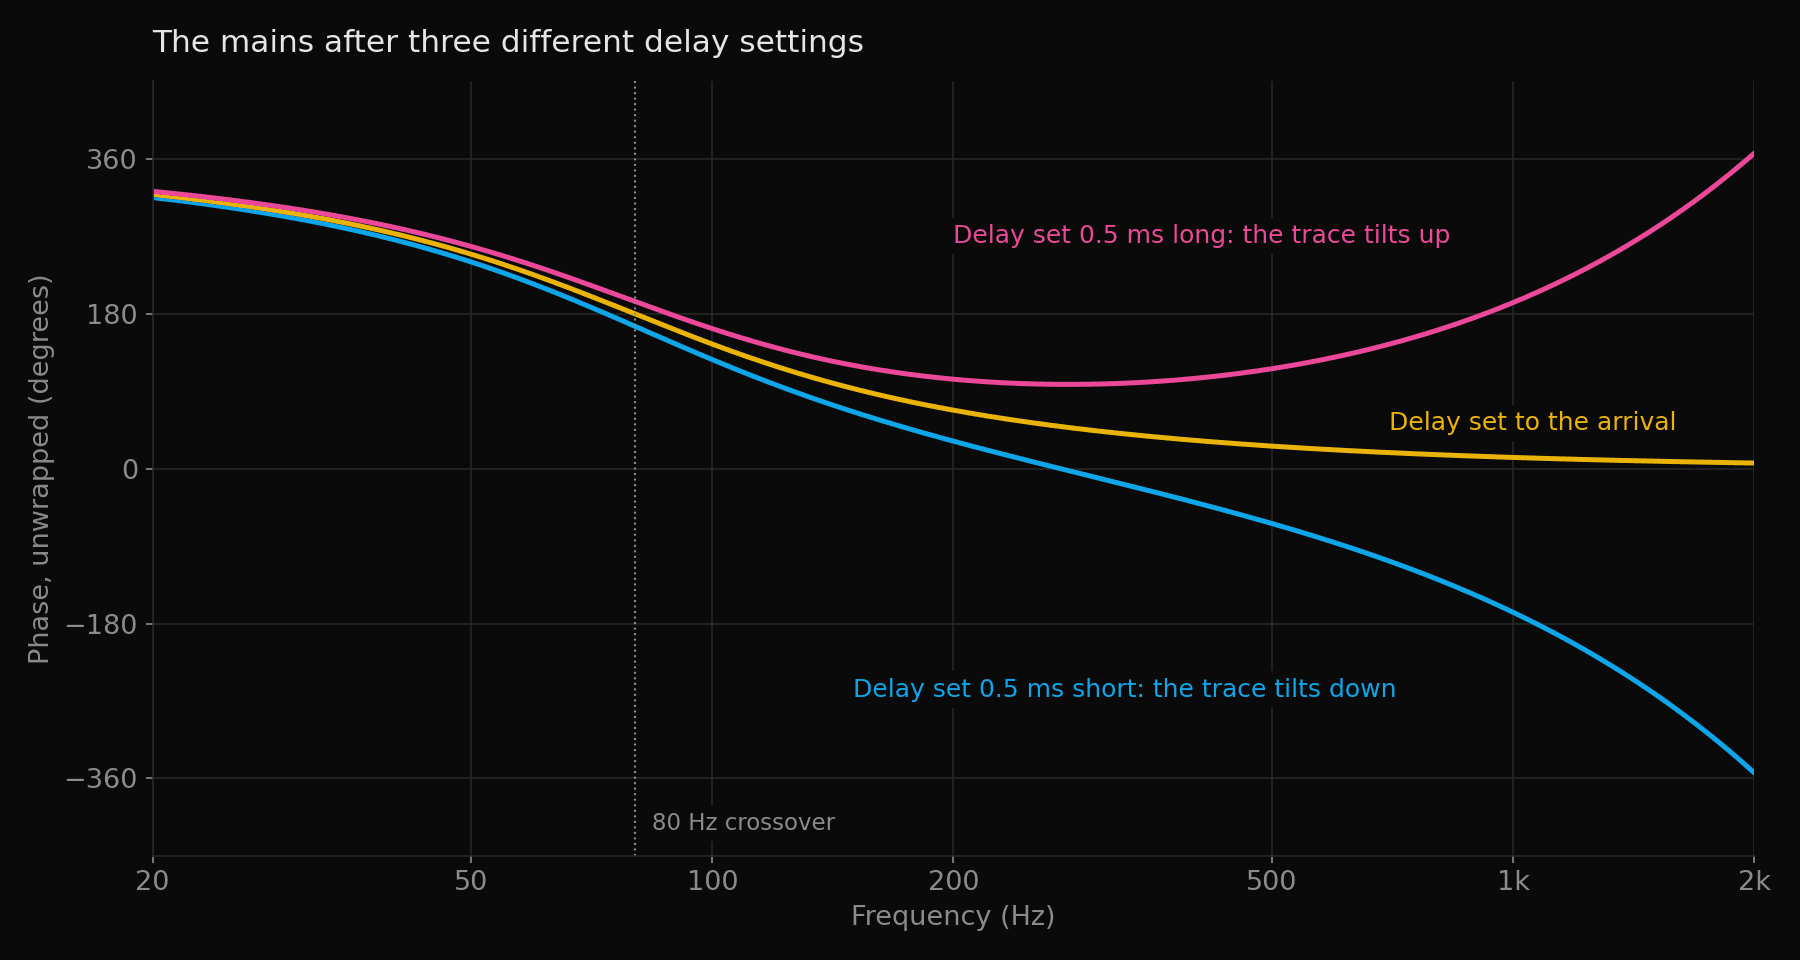
A group delay plot is the slope of this view, turned into milliseconds. A delay error of 0.5 ms moves every point on a group delay plot by 0.5 ms and leaves its shape alone. Reading the shape is safe, and reading the absolute value needs the delay setting.
Omnissiah offers two ways to find the alignment delay, Minimum Phase Error (Least Squares) and Cross Correlation Peak (GCC-PHAT), under Delay Estimation in the tuning settings. On the measurement screen, the delay offset on a snapshot steps by 0.5 ms, so you can add delay to a measurement by hand and watch the trace move. The offset changes the chart only, not the device.
Against Another Speaker
Subtract one speaker's phase from another's, both measured at the same seat, and the result is relative phase. Interface latency and the arrival-time choice cancel out, as long as the latency stayed the same between the two measurements. What remains is the difference in distance plus the difference between the two speakers' filters.
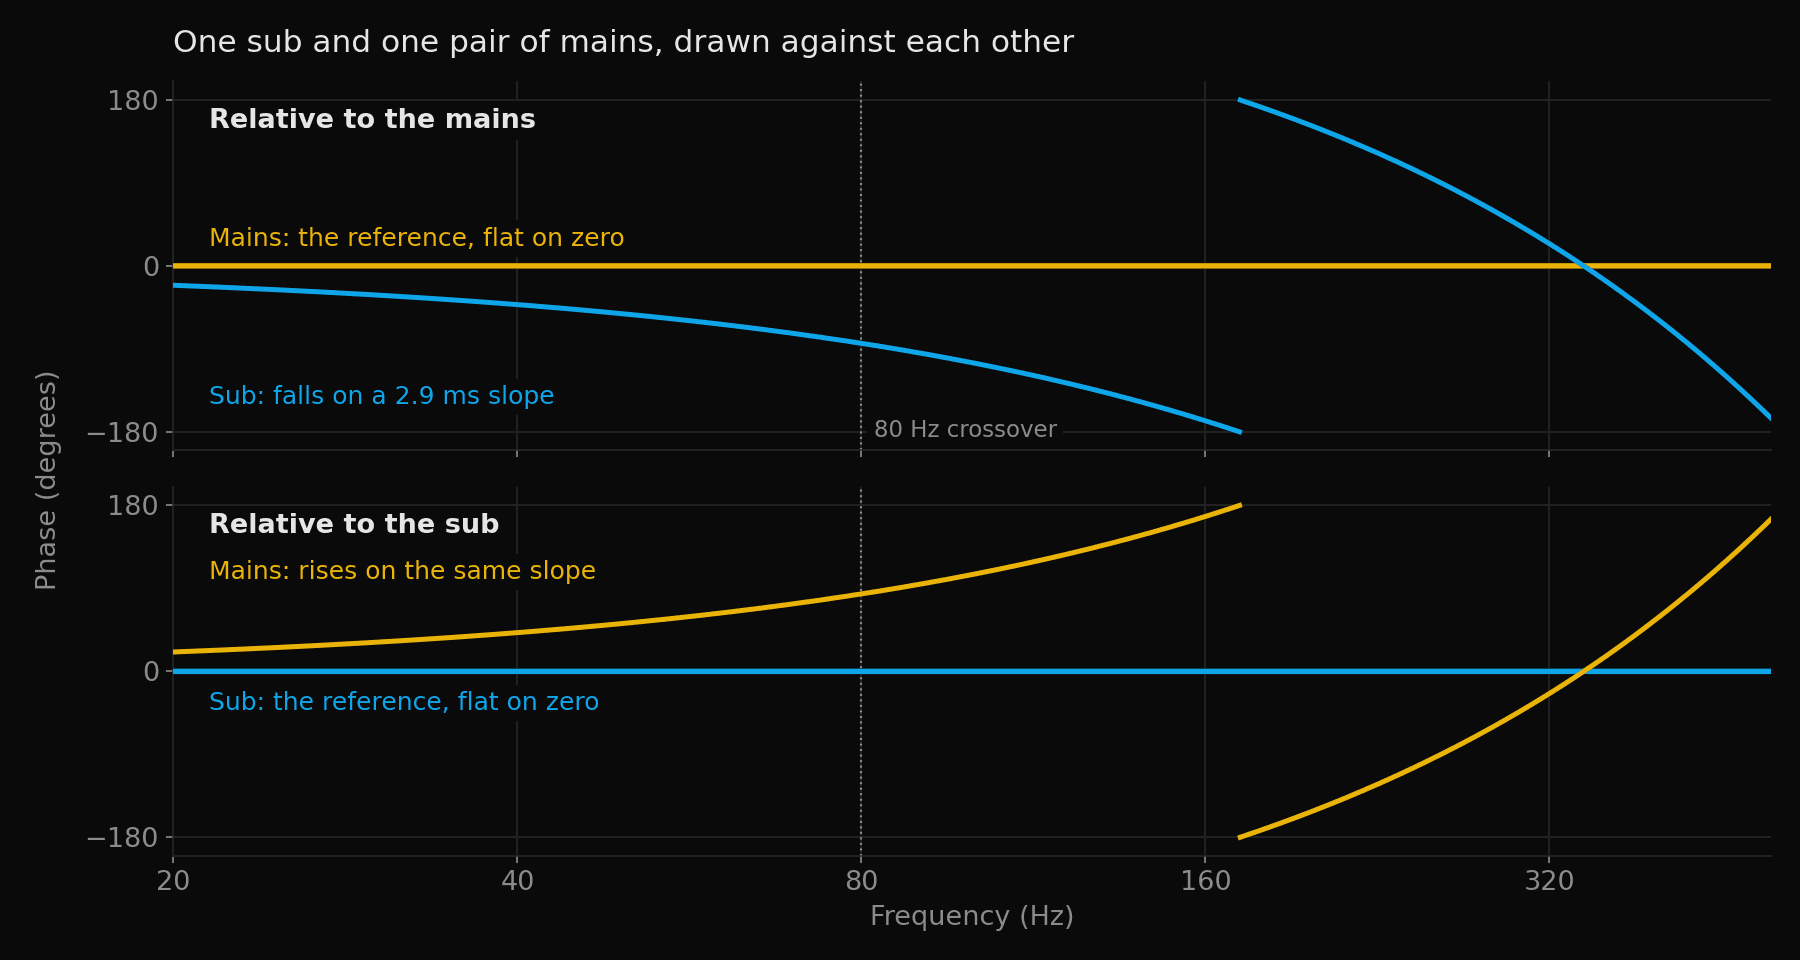
The reference speaker sits flat on zero, because a speaker compared with itself has no difference at any frequency. In the model in the banner, the mains are 2.0 m from the microphone and the sub 3.0 m, on a 4th-order Linkwitz-Riley crossover at 80 Hz. Drawn against the mains, the sub falls on a 2.9 ms slope and reaches minus 180 degrees at 171 Hz.
Choose the sub as the reference and the picture flips. The sub becomes the flat line, and the mains rise on the same slope, 2.9 ms early instead of the sub being 2.9 ms late. Both panels describe one pair of speakers in one room, and the only change is which speaker the graph treats as zero.
Relative phase is the view that predicts summation. Where two speakers play the same frequency at equal level and differ by 180 degrees, they cancel. Through an ideal 4th-order 80 Hz crossover, a 2.9 ms difference costs 3.2 dB at the worst point.
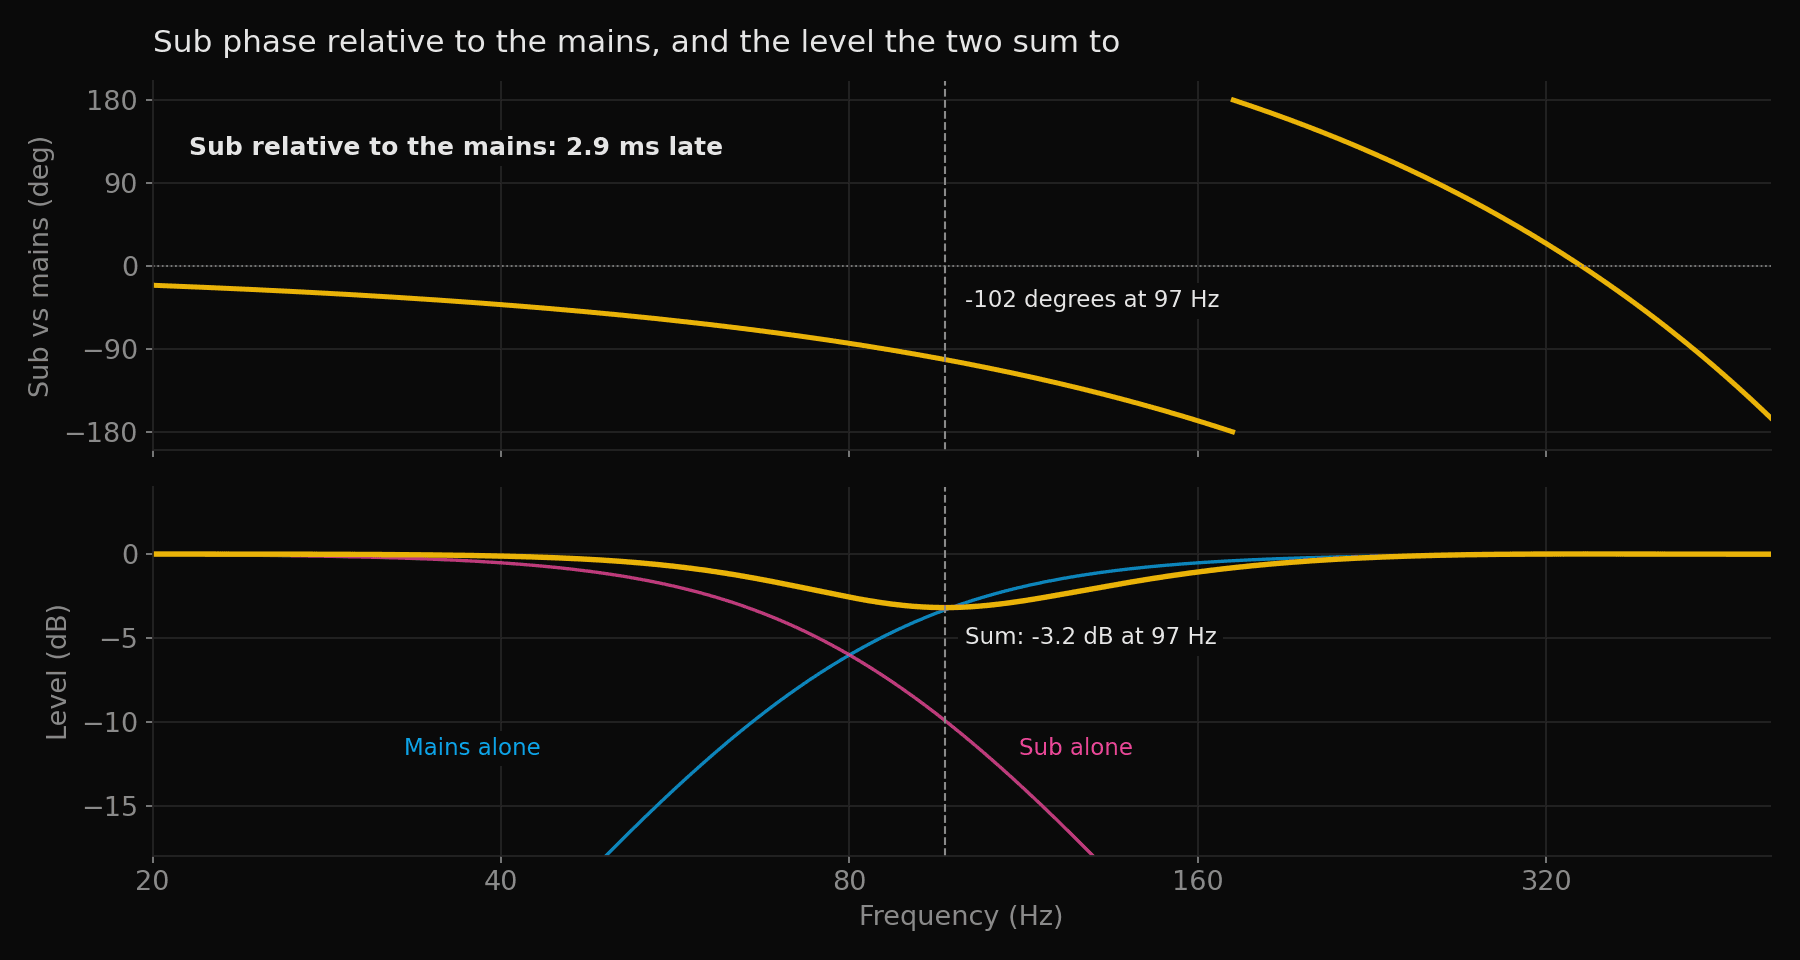
The dip falls at 97 Hz, where the sub is 102 degrees behind the mains and the two levels are close. At 171 Hz the sub is 180 degrees behind, but the sub's level there is 26 dB below the mains, so the sum sits 0.4 dB under the mains alone. Reading a relative phase graph for summation means reading it together with the two levels.
In Omnissiah, Set as Reference on a snapshot makes that snapshot the one the others are compared against. The choice of reference changes the drawing, not the speakers or the sum at the seat.
Reading the NEXUS Drawings
The time alignment drawing on the NEXUS page is labelled PHASE, RELATIVE TO MAINS. The mains are the reference, so the mains trace is a flat line on zero. That flat line carries no information about the mains' own phase. The line is flat because the mains were compared with themselves.
The other trace is labelled SUB, 5ms LATE. A 5 ms difference turns the phase by 360 degrees every 200 Hz, so the sub trace slopes away from zero and wraps round the chart. On a log frequency axis the wraps bunch up towards the right.
The level panel underneath shows what that difference does to the sum. Through an ideal 4th-order 80 Hz crossover, a sub 5 ms late leaves a dip of 11.7 dB at the worst point. Delay the mains by 5 ms to meet the sub and the sub trace joins the mains on zero.
The drawing does not show the sub against the source signal, and it does not show absolute phase. Read as either of those, the slope looks like a fault in the sub. Read as relative phase, the slope is the 5 ms the sub arrives after the mains.
How to Tell Any Graph's Reference
- Read the label and the axis title. Words such as relative to, minus, or referenced to name the reference. A phase axis with no qualifier usually means the source signal or an arrival time.
- Look for a trace pinned at zero. A trace flat on zero at every frequency is almost always the reference, because a real speaker's filters and box turn its phase.
- Count the wraps. A trace that wraps every few tens of hertz still includes latency or distance. A 10 ms delay wraps every 100 Hz, and 1 ms wraps every 1 kHz.
- Check whether the graph came from one channel or a pair. A single measurement can only be drawn against the source or an arrival time. Two speakers on one graph, one of them flat, is a relative plot.
- Look for a delay setting or a note on how the arrival was found. Without one, a tilt in the trace may be the software's choice of delay rather than the speaker.
| Reference | What zero means | What the trace includes | Usual sign |
|---|---|---|---|
| The signal that was sent | The moment the signal left the software | Latency, flight time and the speaker | Wraps every few tens of hertz |
| An arrival time | The delay the software removed | The speaker's filters and box, plus any error in the chosen delay | Turns slowly, may tilt at high frequencies |
| Another speaker | The reference speaker's phase at each frequency | The difference in distance and filters between the two | One trace flat on zero |
Do's and Don'ts
- ✓Find the reference before reading anything off a phase graph.
- ✓Compare speakers in relative phase when the question is whether they add or cancel.
- ✓Measure both speakers through the same interface with the same latency, so the difference is the speakers and not the chain.
- ✓Check the delay setting before blaming a tilted trace on the speaker.
- ✕Don't read a flat reference trace as proof that speaker has perfect phase.
- ✕Don't compare two graphs drawn against different references.
- ✕Don't treat wraps from latency and distance as a fault.
- ✕Don't swap the reference speaker partway through a comparison and expect the slopes to keep their direction.
Frequently Asked Questions
What is a phase graph measured against?
Always against something else: the signal that was sent, an arrival time the software removed, or another speaker. The zero line is that reference, and every trace is the difference from it.
Why does my phase trace wrap round the chart so many times?
The measurement still includes interface latency and the distance to the microphone. Every millisecond is 360 degrees at 1 kHz. Set the measurement delay to the arrival time and the wraps reduce to the speaker's own phase.
Why is one speaker's phase a flat line?
That speaker is the reference. A speaker compared with itself has no difference at any frequency, so its trace sits on zero whatever its real phase is.
Is the NEXUS phase drawing showing absolute phase?
No. The drawing is labelled PHASE, RELATIVE TO MAINS. The mains are the reference and sit on zero, and the sub's slope is the 5 ms it arrives after them.
What is excess phase?
The phase left once an arrival time has been removed. Excess phase shows how a speaker's filters and box shift the timing between frequencies. The value depends on the delay the software chose, so a small error tilts the whole trace.
Which view should I use to align a sub with mains?
Relative phase, measured at the listening seat. Of the three views, relative phase is the one that shows whether the two add or cancel through the crossover. Aim for the two traces to overlap across the octave around the crossover.
Does changing the reference change the sound?
No. The reference sets which trace is drawn flat. The speakers, the room and the sum at the seat are the same whichever one you pick.
Can I compare phase graphs from two different measurement programs?
Only once both use the same reference and the same delay setting. Two programs that pick arrival times differently will draw the same speaker with different tilts.
Conclusion
Every phase graph is the difference between a signal and a reference, so find the reference before reading the graph. Against the source signal it includes the measurement chain and the air. Against an arrival time it shows one speaker's filters, tilted by whatever delay the software chose. Against another speaker it shows the phase difference that determines whether the two add or cancel, and that is the view the NEXUS drawings use.
Glossary
- Reference
- The signal or time a phase graph treats as zero.
- Dual-channel measurement
- A measurement that compares the microphone with the signal that was sent, frequency by frequency.
- Excess phase
- The phase left once an arrival time is removed, which shows the timing differences between frequencies.
- Relative phase
- One speaker's phase minus another's, measured at the same seat. It predicts whether the two add or cancel.
- Wrap
- The jump from minus 180 to plus 180 degrees that a wrapped phase plot draws each time the phase completes another cycle.
Sign up to hear more when we release something new


